Analysis and commentary on trends shaping Asian financial services and markets.
Interactive Tool
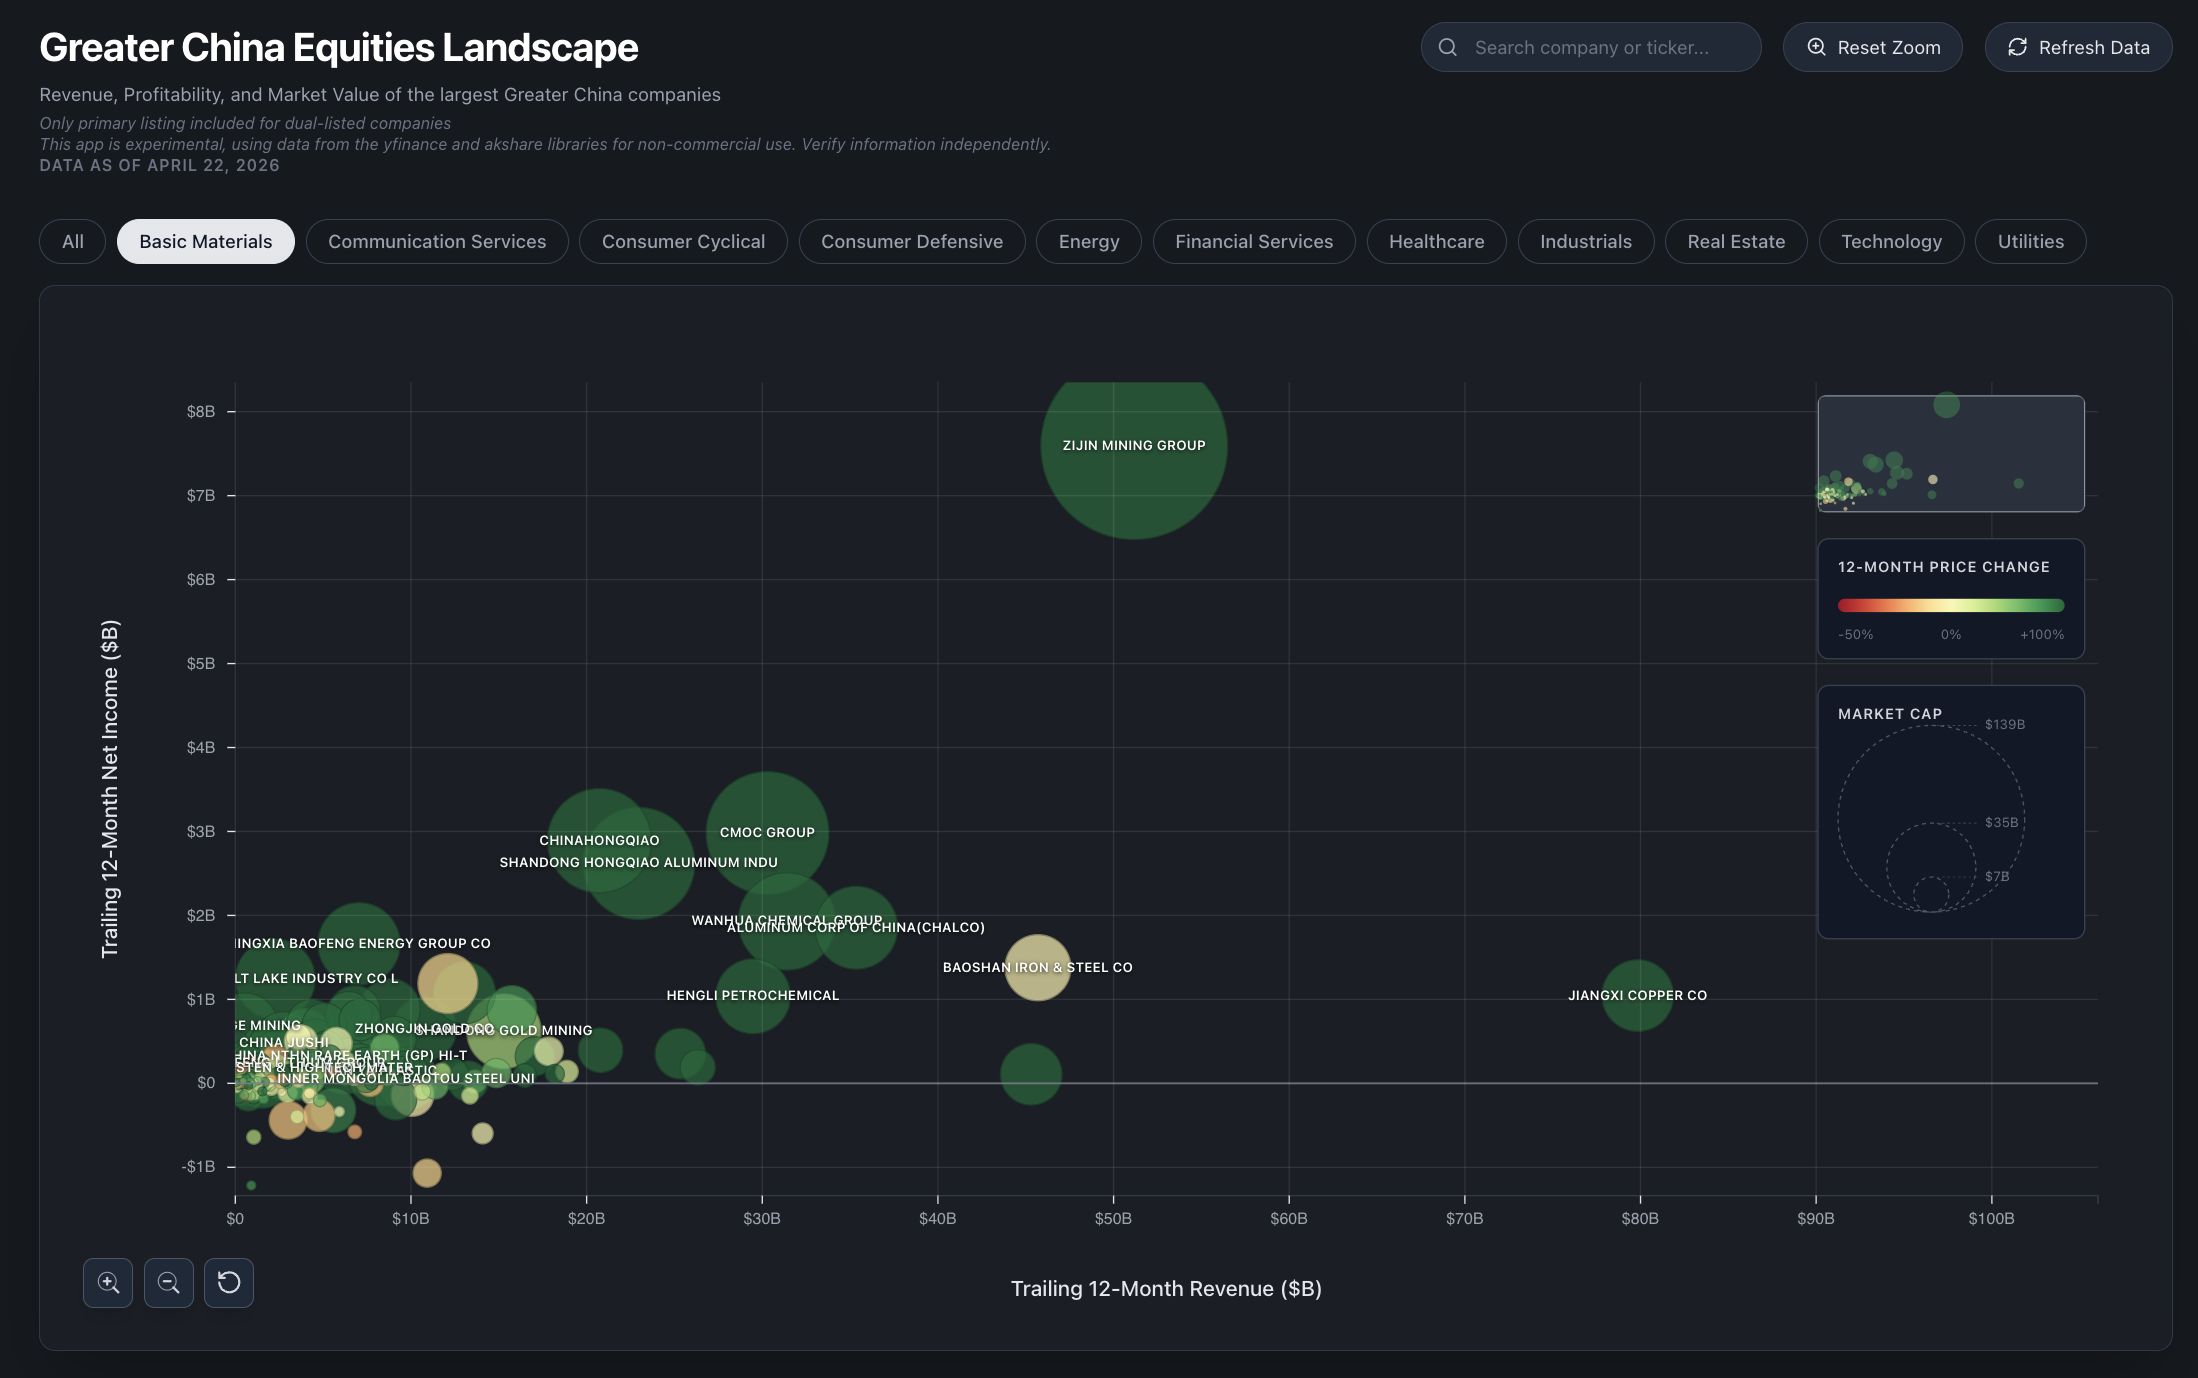
An exploratory tool to compare multiple financial and performance dimensions of the largest Asian companies.
Designed for quick sector comparisons and to surface notable relationships and outliers; data is sourced from public finance APIs
and intended for illustration purposes.
May 2026 • External App
Interactive Dashboard
A comprehensive, data-driven examination of the Renminbi's evolution across six dimensions — payments infrastructure,
reserve currency adoption, capital market access, financial connectivity, digital currency, and geopolitical tailwinds.
Tracks key metrics including SWIFT global share, IMF reserve allocations, CIPS volumes, and e-CNY adoption from inception
to the present, with interactive charts and KPI tracking across all dimensions.
April 2026 • Interactive Dashboard
Opinion & Analysis
Hong Kong has once again ranked third in the Global Financial Centres Index. But what does this ranking actually measure?
We examine the GFCI methodology and take a closer look at Hong Kong's comparative strengths—and at some of the paradoxes that sit beneath the headline ranking.
March 2026 • 8 min read
Market Intelligence
PDF
Industry intelligence on the structural, regulatory, and policy developments shaping Asian financial markets.
This edition covers accelerating ETF issuance, IPO resurgence across Hong Kong and India, expanded derivatives toolkits,
and how early-March volatility tested the region's evolving market infrastructure. Designed for financial executives
navigating cross-border activity and structural change.
March 2026 • 29 pages • PDF